Organizations
The Organizations page provides visibility into your multi-account cloud structure. Most enterprises operate multiple cloud accounts, subscriptions, or projects — CLARITY discovers and maps these relationships so you can understand costs at the organizational level.
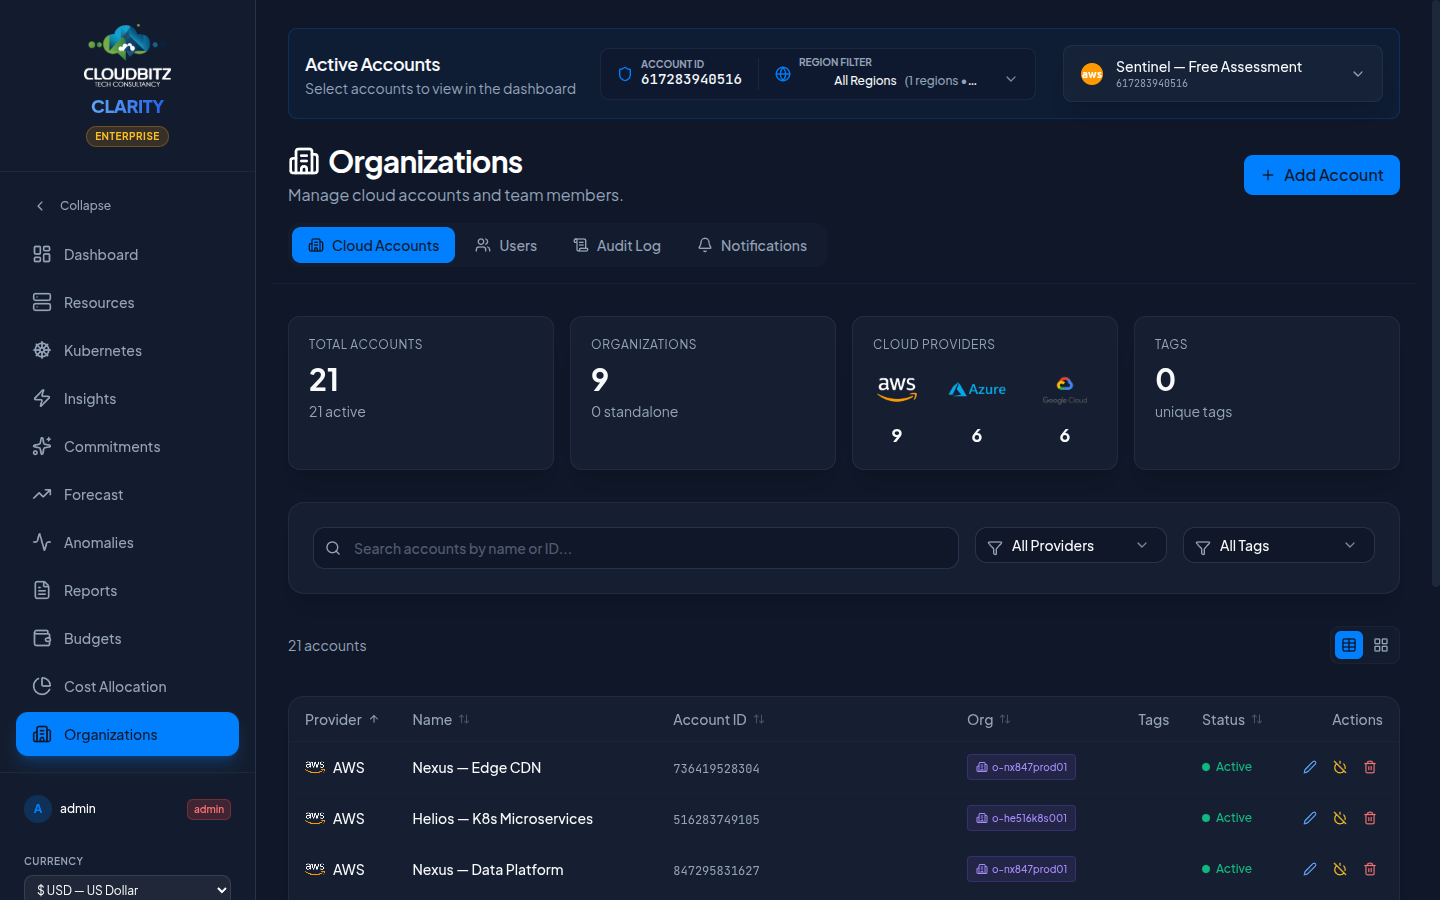
Multi-Account organization awareness
CLARITY automatically detects organizational hierarchies when you connect cloud credentials:
| Provider | Organizational Structure |
|---|---|
| AWS | Organizations with Organizational Units (OUs) and member accounts |
| Azure | Management Groups containing subscriptions |
| GCP | Organizations containing folders and projects |
INFO
Organization discovery happens automatically during sync. No additional configuration is required beyond connecting your cloud credentials with appropriate permissions.
AWS organizations
Org unit hierarchy
If your connected AWS account belongs to an AWS Organization, CLARITY discovers and displays:
- Organization root — The top-level org container
- Organizational Units (OUs) — Groupings like "Production", "Development", "Security"
- Member accounts — Individual AWS accounts within each OU
The hierarchy is presented as an expandable tree, showing how accounts are organized.
Member accounts
Each member account shows:
- Account ID and friendly name
- OU membership — Which organizational unit it belongs to
- Status — Whether the account is connected to CLARITY ("In System" badge)
- Cost contribution — That account's share of the organization's total spend
TIP
Connect all member accounts in your AWS Organization to get complete cost visibility. Accounts that are not connected show in the hierarchy but without cost data.
Azure subscriptions and management groups
Subscription discovery
CLARITY discovers all Azure subscriptions within your Azure AD tenant:
- Subscription name and ID
- State — Active, disabled, or warned
- Spend — Monthly cost for each subscription
- In System badge — Whether the subscription is connected for cost tracking
Management groups
If your Azure tenant uses Management Groups, CLARITY maps the hierarchy:
- Root Management Group — Top-level container
- Child groups — Nested management groups for organizational structure
- Subscriptions — Which subscriptions belong to each group
The management group tree provides a clear picture of how your Azure estate is structured for governance and policy purposes.
WARNING
Management Group discovery requires appropriate permissions. If your service principal does not have Management Group Reader access, CLARITY will still show subscriptions but without the group hierarchy.
GCP project organization
Project discovery
For GCP, CLARITY maps your project structure:
- Organization — The top-level GCP organization (if applicable)
- Projects — Individual GCP projects with their IDs and names
- Billing account — Which billing account each project charges to
- Cost contribution — Per-project spend
Folder hierarchy
If your GCP organization uses folders to group projects, the hierarchy is displayed:
- Organization root
- Folders (e.g., "Production", "Sandbox")
- Projects within each folder
- Folders (e.g., "Production", "Sandbox")
Per-Organization cost aggregation
The Organizations page aggregates costs at every level of the hierarchy:
| Level | What You See |
|---|---|
| Organization | Total spend across all accounts/subscriptions/projects |
| OU / Management Group / Folder | Subtotal for that grouping |
| Account / Subscription / Project | Individual cost breakdown |
This top-down view makes it easy to identify which parts of your organization are driving the most spend.
Cross-Account trends
Compare spending across accounts within the same organization:
- Month-over-month change per account
- Relative share — What percentage of total org spend each account represents
- Growth rate — Which accounts are growing fastest
Cross-Account visibility
With organization awareness, several CLARITY features gain additional context:
Reports
Organization-aware reports include:
- Org hierarchy visualization in the executive section
- Per-account breakdowns within the spend analysis
- Cross-account anomaly comparison
Cost allocation
Chargeback rules can reference specific accounts or subscriptions, enabling allocation like:
- "All costs from the
sandboxOU go to the R&D cost center" - "Azure subscription
production-01maps to the Platform team"
Insights
Optimization insights are surfaced per account, with the ability to compare similar resources across accounts (e.g., "Account A runs m5.xlarge at 10% CPU while Account B runs the same at 80%").
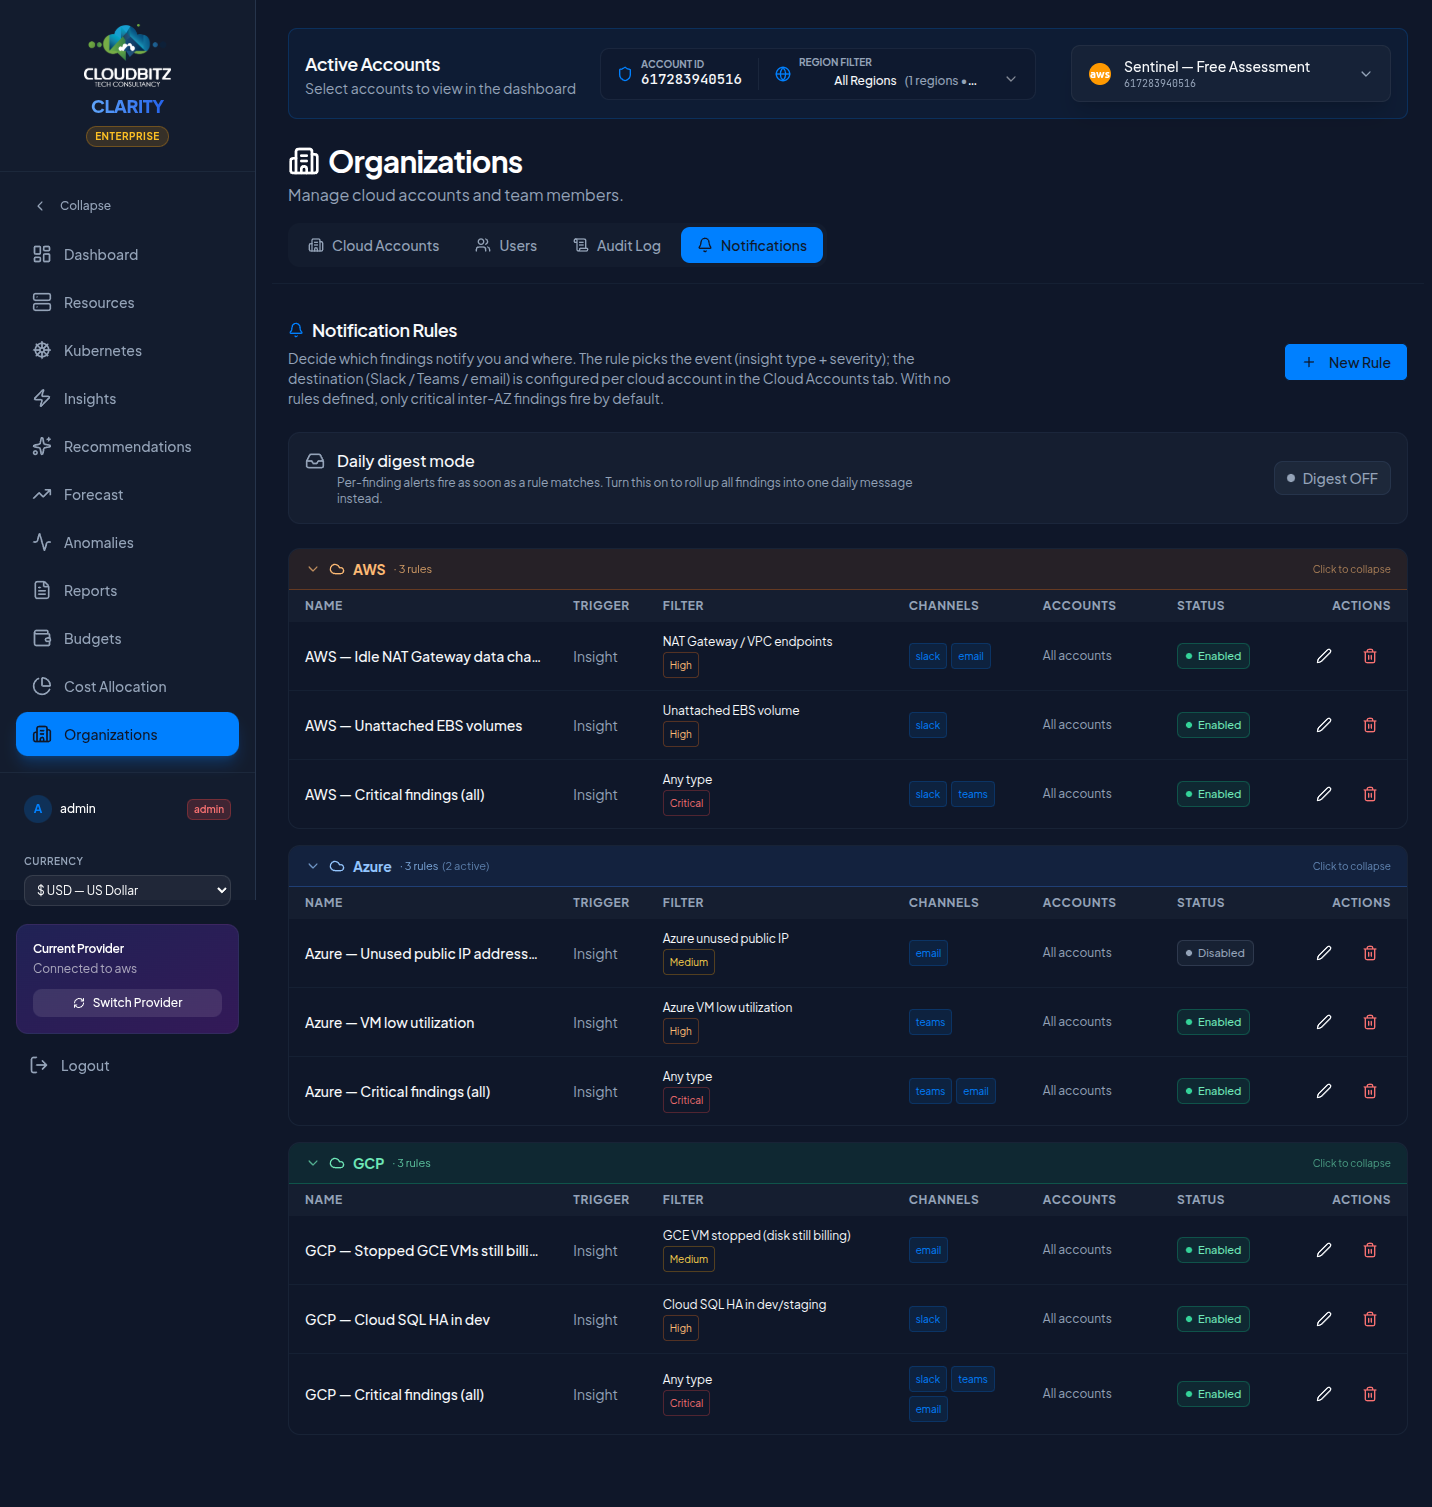
Notification rules
Admins also see a Notification Rules tab where they decide exactly which findings route to which channels. The previous "everything to one webhook" model is replaced by per-rule routing — different teams can subscribe to different signals on different channels without one team's noise drowning out another's.
What a rule controls
Each rule answers four questions:
| Field | What it does |
|---|---|
| Cloud provider scope | AWS, Azure, GCP, or Multi-cloud. Determines which insight types and accounts the rule can reference. A rule scoped to AWS will only match AWS findings, even if it references an Azure account by mistake. |
| Insight type filter | Optional. Match a specific finding type (e.g. Idle RDS instance) or leave blank for "all types in scope". |
| Severity filter | Multi-select: Critical / High / Medium / Low. Empty selection = "all severities". |
| Account filter | Multi-select list of connected accounts. Empty selection = "all accounts in this provider scope". |
| Channels | Slack webhook, Teams webhook, email — toggle any combination. |
| Delivery mode | Immediate fires per finding the moment a sync detects it. Daily digest queues findings and flushes once a day at your preferred UTC hour. |
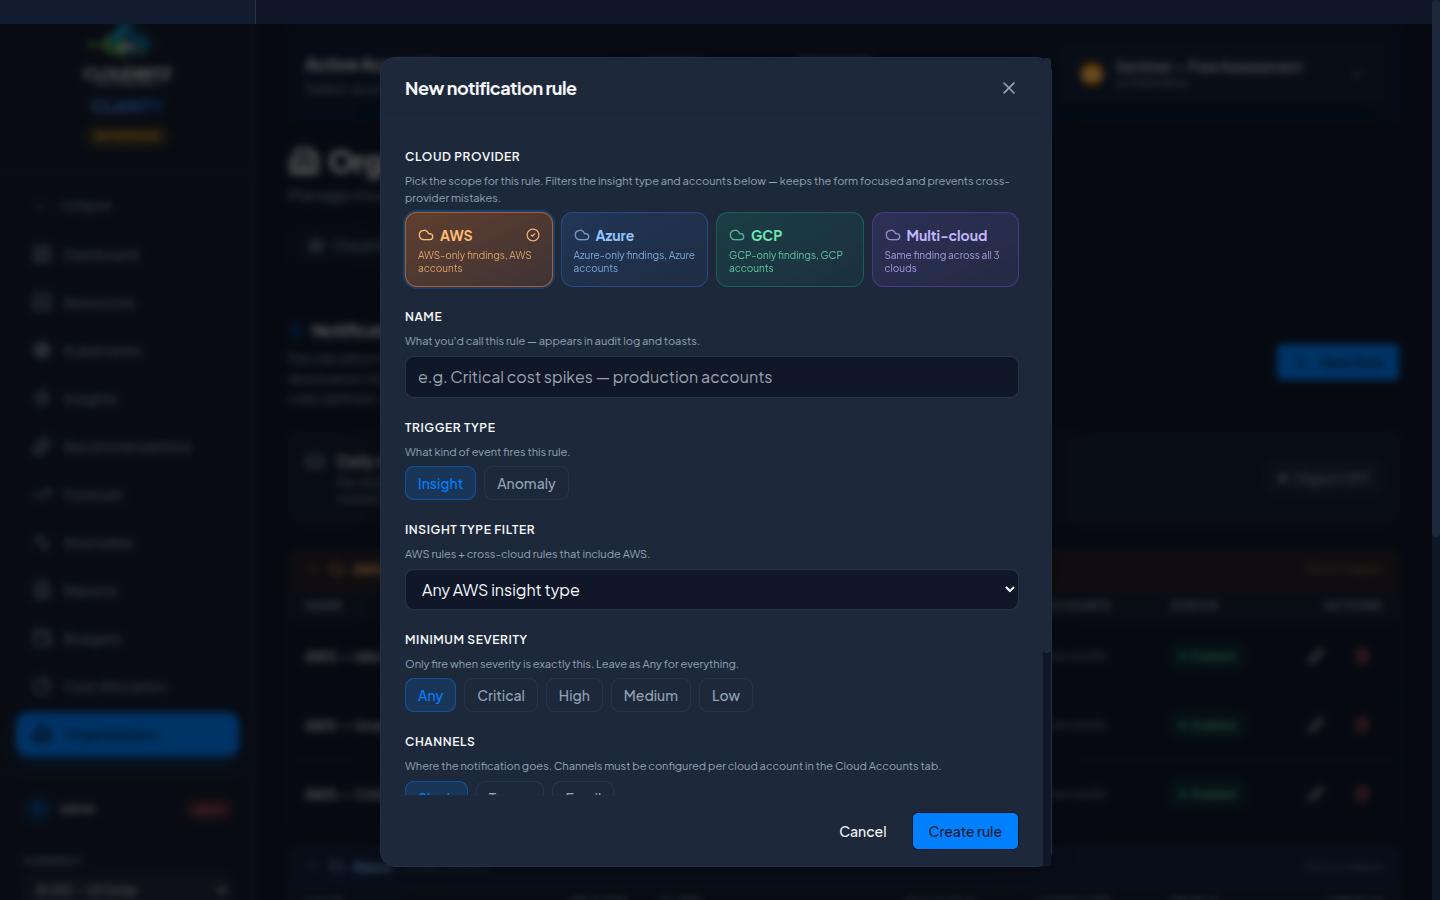
Provider scoping prevents cross-cloud mistakes
The rule creation modal opens with four tabs at the top — AWS, Azure, GCP, Multi-cloud. Switching tabs filters the insight-type dropdown and the account picker to that provider's items. You can't accidentally save a rule that targets Idle RDS instance on a GCP project, because the dropdown won't list that combination.
The rules table on the main tab mirrors this — rules are grouped into per-provider cards (AWS orange, Azure blue, GCP emerald, Multi-cloud violet) with chevron headers showing rule count and active count. Collapse a card to hide rules from clouds you're not focused on today; the collapse state persists across page reloads.
Daily digest mode
A digest rule lets you avoid notification fatigue without losing visibility. Instead of getting pinged every time a finding is detected, the rule accumulates matches and sends one consolidated message at the hour you choose.
Findings in the digest email are grouped by severity (Critical → High → Medium → Low), so the most important items always land at the top. If a finding lands during the day and you resolve it from the Insights page before the digest fires, it's automatically removed from the next flush — you won't get notified about something you've already handled.
TIP
Use immediate delivery for Critical findings to a Slack channel monitored by oncall, and digest delivery for Medium / Low findings to a once-a-day email. This is the highest-signal pattern most teams converge on.
Per-finding snooze
When you mute a specific finding for 30 days from the Insights page, the rule engine respects that decision — no notifications will be dispatched for that exact resource during the snooze window. Once 30 days pass, the finding returns to active automatically, and if it's still present, the rule will resume firing.
This is keyed by the finding's stable hash, not by row id, so sync-driven regenerations of the underlying row don't accidentally re-pierce the snooze.
TIP
The Notification Rules tab is admin-only. Each admin owns their own rules; an admin cannot edit another admin's routing.
Audit log
Admins also see a third tab — Audit Log — that records every significant action taken inside your CLARITY tenant. It's the page you open when someone asks "who connected this account?", "when did this credential last rotate?", or "show me everything user X did last quarter."
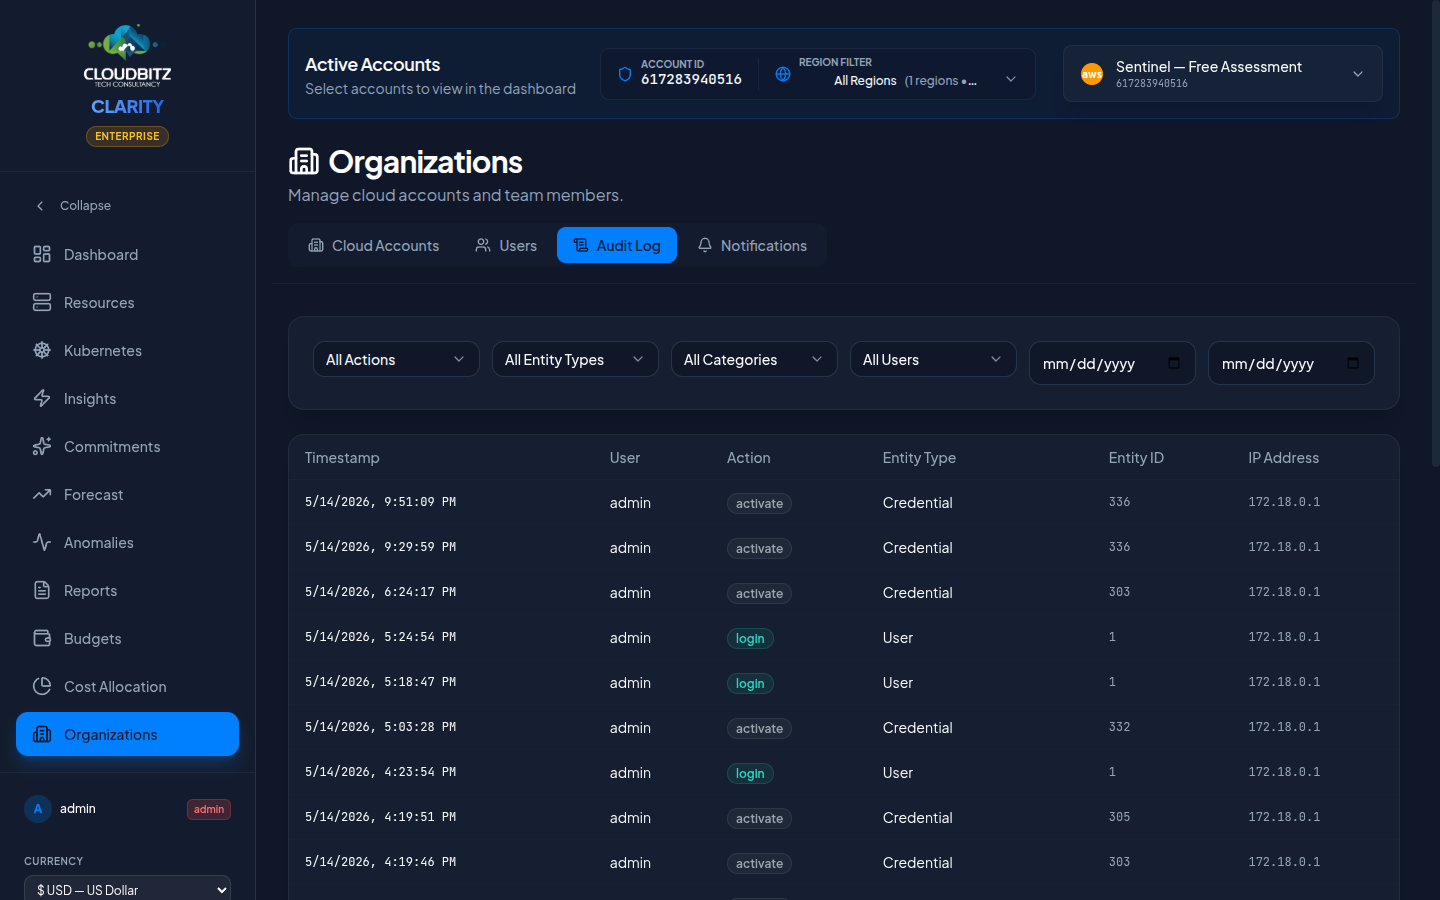
What's logged
CLARITY records five categories of events. Every entry includes timestamp, actor (user or system), action, target entity (account, credential, report, user, etc.), source IP, and a structured JSON payload describing what changed.
| Category | Examples |
|---|---|
| Authentication | Login success, login failure, logout, password change, SSO redirect |
| Account changes | Cloud credential added, updated, deleted, deactivated; account renamed |
| Sync runs | Sync started, sync completed, sync failed, partial sync (per-account, per-provider) |
| Reports & exports | Report generated, scheduled, sent; CSV exported |
| Configuration | Cost-center changes, allocation rule edits, budget create/update/delete, tier change |
Filters and retention
The Audit Log tab provides filters for action type, entity type, and date range. Retention is tier-dependent — Starter 30 days, Pro 90 days, Business 1 year, Enterprise forever — and is enforced by an automated cleanup job.
TIP
The Audit Log tab is admin-only. Non-admin users see only Cloud Accounts and Users (and never the Audit Log or Notification Rules tabs).
Getting started
Required permissions
To discover organizational structure, your connected credentials need:
| Provider | Required Access |
|---|---|
| AWS | organizations:DescribeOrganization, organizations:ListAccounts |
| Azure | Subscription Reader, Management Group Reader (optional) |
| GCP | resourcemanager.projects.list, resourcemanager.folders.list (optional) |
Connecting additional accounts
To maximize visibility:
- Connect at least one account per organization
- CLARITY will discover the org hierarchy automatically
- Connect additional accounts to fill in cost data for discovered members
- Accounts not yet connected appear with an "External" indicator
TIP
You do not need to connect every account to see the organizational structure. One account with organization-level read permissions is enough to discover the hierarchy. Connect additional accounts when you need their cost data.