

Reports
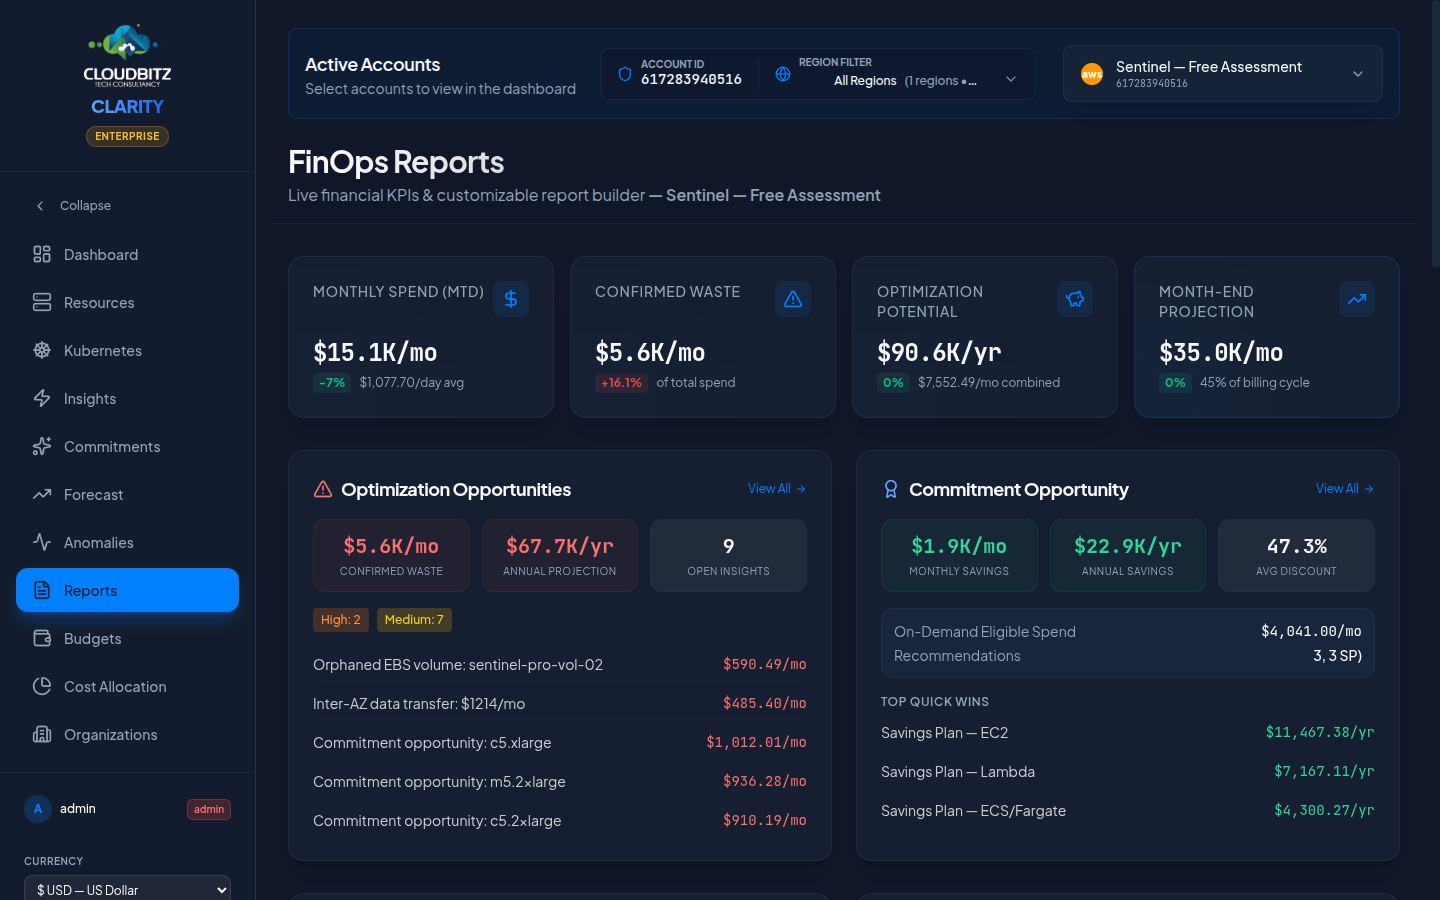
The Reports page lets you generate professional cloud cost reports for different audiences — from executive summaries for leadership to detailed technical reviews for engineering teams.
Report templates
CLARITY provides five pre-built templates, each tailored to a specific audience:
| Template | Audience | Focus |
|---|---|---|
| C-Level Briefing | C-suite, Finance | High-level spend, trends, and key savings opportunities |
| Complete FinOps Audit | Cloud/FinOps team | Deep dive into all cost dimensions with full data |
| Monthly Review | Recurring stakeholders | The standard month-end pack |
| Quick Win Report | Engineering leads | The shortest path to actionable savings |
| Fleet-Wide Overview | Multi-account owners | Cross-account roll-up |
Each template pre-selects the most relevant sections for its audience, but you can customize which sections to include.
Available sections
Reports are composed of modular sections. Select any combination:
| Section | Contents |
|---|---|
| Executive Summary | Total spend, MoM change, top savings, AI-generated narrative |
| Spend Analysis | Cost breakdown by service, category, region, and provider |
| Right-Sizing | Instance optimization recommendations with savings estimates |
| Optimization | All actionable recommendations ranked by savings potential |
| Anomalies | Detected cost anomalies during the reporting period |
| Forecast | Projected spend for the next 30 and 90 days |
| Commitments | Active commitments, utilization rates, and new recommendations |
| Inventory | Full resource inventory with cost and state information |
| Kubernetes | Cluster costs, namespace allocation, and K8s insights |
| Showback | Tag-based cost distribution by team or department |
| Tag Health | Cross-provider tag-coverage measurement — coverage % (count + cost-weighted), severity tier, worst-3 categories by gap, top 25 resources missing required tags. Surfaces the chargeback-accuracy disclosure that every other section's numbers depend on. |
| ROI Report | Counterfactual savings — actual spend vs. trajectory without CLARITY action |
| Business Outcomes | Per-cost-center spend rollup with budget vs. actual |
| Cross-Account | Multi-account comparison with provider summary, top movers, and waste hotspots |
| AI Validation | AI analysis results for insights and recommendations |
TIP
For recurring stakeholder reports, start with a template and remove sections that are not relevant. This keeps reports focused and readable.
Custom section selection
When creating a report, you can:
- Start from a template to get a sensible default selection
- Add or remove sections using the checkbox list
- Reorder sections by dragging them into your preferred sequence
- Save as a custom template for future use
Report generation
On-Demand reports
Click Generate Report to create a report immediately. The report covers the currently selected date range and provider filter.
AI-Enhanced narratives
When AI analysis is enabled, report sections include AI-generated narrative summaries that:
- Explain cost trends in plain language
- Highlight the most impactful findings
- Provide context for anomalies and recommendations
- Summarize the overall health of your cloud spend
INFO
AI narratives adapt to the report audience. Executive reports use business-friendly language, while technical reports include more detail about resource types and configurations.
Scheduling reports
Set up automated report delivery on a recurring schedule:
- Select the report template and sections
- Choose the frequency — Weekly or Monthly. There is no daily option and no day-of-week picker: weekly runs seven days after you create the schedule, and monthly runs on the 1st of each month at 08:00 UTC.
- Add email recipients
- Optionally set a provider filter (all providers or a specific one)
Scheduled reports are generated automatically and an email is sent to the recipients.
What the scheduled email actually contains
The email is a summary and a link back to CLARITY — section titles and record counts. The report itself is not attached; there is no PDF or CSV attachment. Recipients need a CLARITY login to read the report.
Scheduled delivery also requires your operator to have configured an email provider. If none is configured, the platform logs the message and records the send as successful without anything being delivered.
Exporting a report
Two options, from any generated report:
- CSV — downloads the report's tabular data.
- Print — opens your browser's print dialog, from which you can choose "Save as PDF".
There is no server-side PDF generation
CLARITY does not render PDFs itself, so there is no "Export PDF" button and no cover page or table of contents. What you get is the browser's own print-to-PDF of a print-styled page. It is perfectly usable for sharing and archiving, but it is browser output, not a generated document.
Organization-Aware reports
If you have multiple cloud accounts within an organization (AWS Organizations, Azure Management Groups), reports can include organization context:
- Org hierarchy visualization
- Per-account cost breakdown within the org
- Cross-account trends and anomalies
This context is automatically included when organization data is available.
Cross-Account executive report
The Cross-Account Executive template provides a consolidated view across all connected cloud accounts in a single report. It is designed for organizations managing multiple accounts across different providers.
The report includes:
- KPI summary — Total projected spend, month-over-month change, total waste, and number of active accounts
- Provider summary — Aggregated spend and account count per cloud provider
- Account ranking — All accounts ranked by projected spend, showing MTD cost, MoM change, waste, and waste ratio
- Top movers — Accounts with the largest month-over-month cost changes (positive or negative)
- Waste hotspots — Accounts with the highest optimization potential, ranked by waste amount
TIP
Use the Cross-Account report to identify which accounts need attention. Accounts with high waste ratios or large MoM increases are the best candidates for immediate optimization.