

Cost forecast
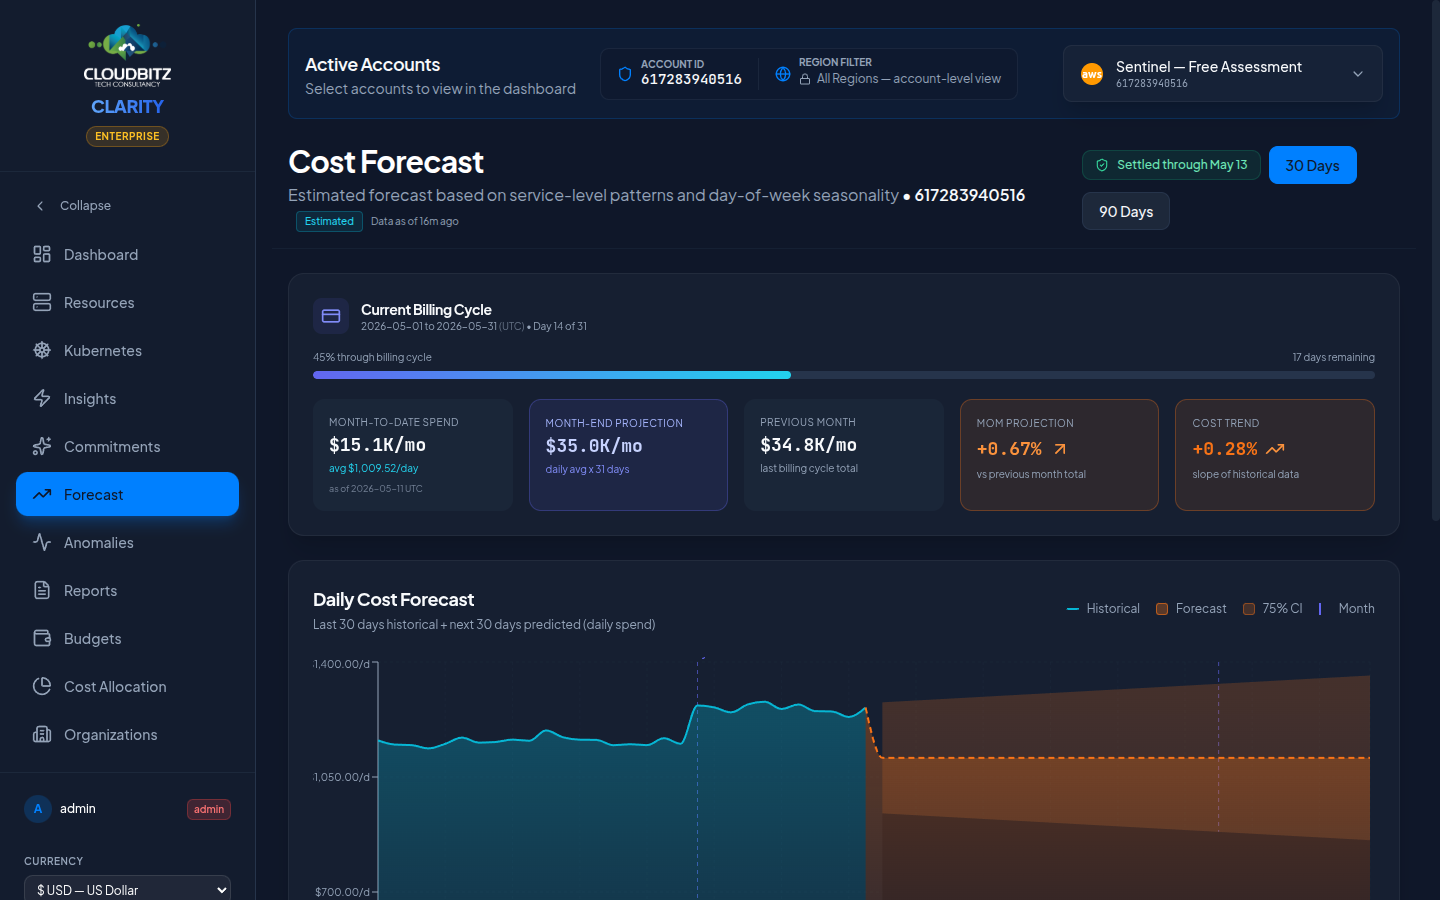
The Forecast page projects your future cloud spend based on historical patterns and provider-native forecasting models. Use it to anticipate budget needs, plan capacity, and catch cost trends before they become problems.
How forecasting works
CLARITY combines two forecasting approaches for maximum accuracy:
Provider-Native models
Each cloud provider offers built-in forecasting:
| Provider | Forecasting Method |
|---|---|
| AWS | Cost Explorer ML-based forecast |
| Azure | Cost Management Forecast API |
| GCP | Statistical regression on BigQuery billing data |
These models leverage the provider's own historical billing data and machine learning capabilities.
Statistical regression
As a complement (and fallback), CLARITY runs its own linear regression analysis on your cost history. This method requires a minimum of 14 days of data to produce meaningful projections.
INFO
Provider-native forecasts are generally more accurate because they have access to deeper billing metadata. CLARITY's statistical model serves as a second opinion and covers scenarios where the provider forecast is unavailable.
Projection periods
The forecast offers two projection windows:
| Period | Best For |
|---|---|
| 30-Day | Month-end budget planning, near-term spend tracking |
| 90-Day | Quarterly budget cycles, trend analysis, capacity planning |
Confidence intervals
Forecasts include upper and lower confidence bounds displayed as a shaded band around the projected cost line:
- Upper bound — The high-end estimate if costs trend upward
- Lower bound — The low-end estimate if costs stabilize or decrease
- Midpoint — The most likely projection
The width of the confidence band reflects how predictable your spending has been. Steady, consistent spend produces a narrow band. Volatile or spiky spend produces a wider band.
Month-End projection
At the top of the forecast page, a prominent card shows the projected end-of-month cost. This figure answers the most common question: "What will this month's bill be?"
The month-end projection:
- Uses actual billing days elapsed (not calendar days) for accuracy
- Sets a floor at current MTD spend (the projection never goes below what you have already spent)
- Updates daily as new billing data arrives
Data as of Timestamp
The forecast displays a "Data as of" timestamp showing when the underlying billing data was last refreshed. This helps you assess how current the projection is.
Understanding forecast accuracy
Several factors influence how accurate a forecast will be:
When forecasts are most reliable
- Steady-state workloads — Consistent, predictable resource usage
- Mid-to-late month — More data points improve the projection
- Mature accounts — Accounts with 3+ months of billing history
- Commitment-heavy spend — Reserved capacity provides cost predictability
When forecasts are least reliable
- Early in the month (days 1-6) — Too few data points for meaningful projection
- After major changes — New deployments, migrations, or decommissions skew the baseline
- Seasonal workloads — Burst patterns that differ from recent history
- First month of a new account — Insufficient historical data
Early-Month Projections
In the first few days of a billing cycle, forecasts have wide confidence intervals. CLARITY automatically switches to a "Last 30 Days" view early in the month to provide more useful context.
Forecast by provider
When multiple cloud providers are connected, you can view forecasts:
- Combined — Total projected spend across all providers
- Per-provider — Individual forecast for AWS, Azure, or GCP
Use the provider filter to switch between views.
Forecast vs. budget
Compare the projected spend against your active budgets to see if you are on track:
| Scenario | Indicator |
|---|---|
| Forecast below budget | Green — on track |
| Forecast approaching budget | Amber — monitor closely |
| Forecast exceeds budget | Red — action needed |
This comparison appears on both the Forecast page and the Dashboard's budget status panel.